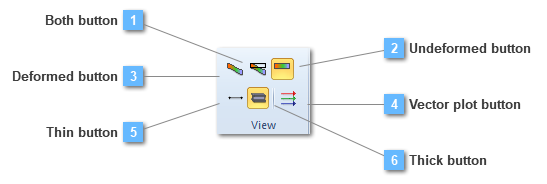
This option will be functional only in case of plotting the principal stresses. That is, vector plot utility is useful so as to figure out directions and sizes of these principal stresses, besides they are only plotted on nodes.
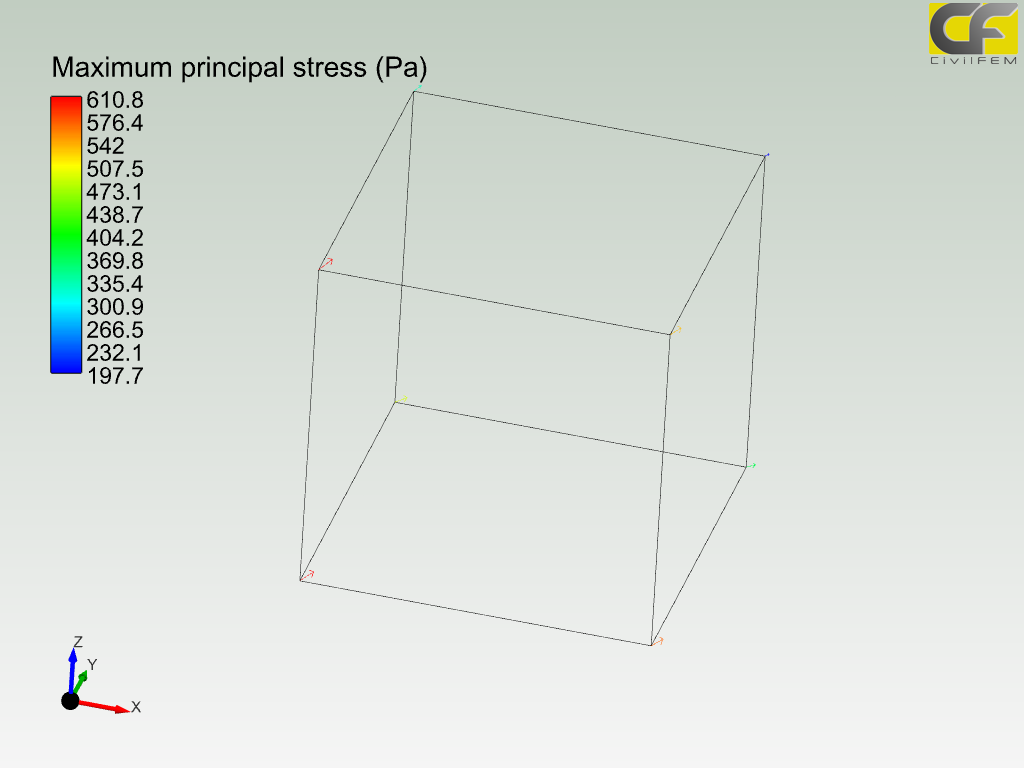
The next image pretends to clarify this subject:
Loads have been plotted on nodes and it is noticeable that they tend to a specific direction. Moreover, loads from the left, from top and bottom nodes, are bigger than the rest of loads, so the user may suppose how the stresses distribution is.